RacisThe geography über nerds at the Floating Sheep collective have made another fascinating map. They mapped geo-tagged racist tweets that emerged after President Barack Obama’s re-election and computed location quotients based on the total state volume of tweets. One weakness of the map is that the sample size was small since they only sampled 0.05% of all geotagged tweets in early November. Even so, a core region of racist tweets shows up in the Deep South–Alabama and Mississippi lead the way with location quotients of 8.1 and 7.4, respectively. That means they have about eight times the normal rate of racist tweets. Even Minnesota has a higher than normal location quotient, although the numbers were small. Read more here or check out the interactive map here.
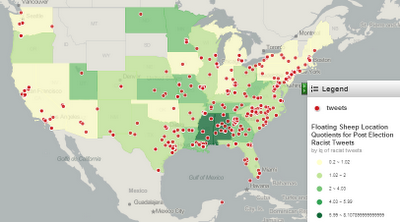
Racist Tweets in November 2012. Cartography: Floating Sheep, Matthew Zook, Department of Geography, University of Kentucky.